本文总结自 Profiling and Optimizing Go [1] ,对应的 PPT [2] ,有梯子的可以直接看视频,没梯子的也可以看下这篇文章:) 。
Golang 的 runtime 内建了强大的分析工具 pprof,能帮助我们对程序运行时的 CPU、内存进行分析。
首先,跟随视频,将作者提供的代码 clone 下来。在我们的工作区执行 go get -v github.com/prashantv/go_profiling_talk即可。
进入src/github.com/prashantv/go_profiling_talk,master 分支是优化过的最快的版本,slow 分支是优化前的版本,执行go run main.go即可启动一个 http 服务。
代码说明:
- 以一个 http 服务运行,有两个请求路径/hello和/simple
- /hello的请求会增加一些统计信息的记录,然后输出Hello world
- /simple的请求则是简单的输出Hello world!
- 实践目的:通过 pprof 分析优化/hello接口的性能,使其与/simple接口的性能差距尽量小。
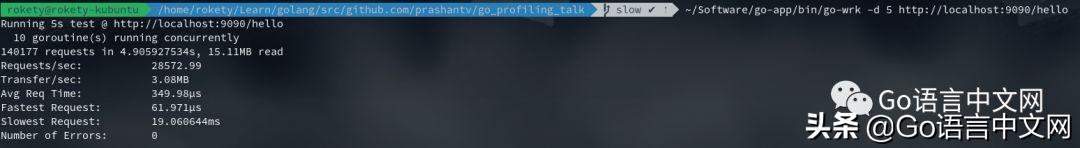
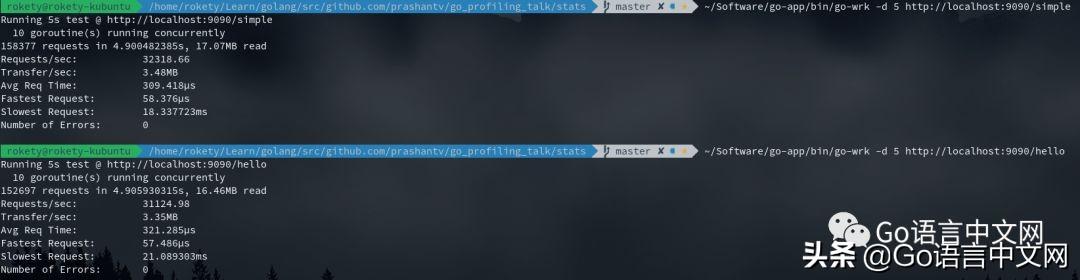
先来看看未优化前/hello和/simple的性能对比:

很明显/hello要比/simple慢很多,接下来就开始我们的性能分析之旅。首先需要保证/hello接口处于压测状态,因为这样才能进行性能分析的数据采样。
执行~/Software/go-app/bin/go-wrk -d 500 进行 500s 的持续压测。
访问,能够看到:
- {当前协程数量} goroutine
- {当前堆上对象的数量} heap
goroutine 页面
展示了当前正在运行的所有协程的调用栈,每一块调用栈的开头表示 pprof 采样时有多少个协程处于这个调用栈,如下表示有 4 个协程:
4 @ 0x42ec9c 0x429daa 0x4293a7 0x491b9e 0x491c1d 0x4929ba 0x563772 0x575aad 0x65bef5 0x516a5a 0x51790c 0x517b74 0x5e9fd0 0x5e9ddb 0x656169 0x65d1fc 0x660ffe 0x45d5e1
#	0x4293a6	 internal / poll .runtime_pollWait+0x56		/home/rokety/Software/go/src/runtime/ net poll.go:173
#	0x491b9d	internal/poll.(*pollDesc).wait+0xad		/home/rokety/Software/go/src/internal/poll/fd_poll_runtime.go:85
#	0x491c1c	internal/poll.(*pollDesc).waitRead+0x3c		/home/rokety/Software/go/src/internal/poll/fd_poll_runtime.go:90
#	0x4929b9	internal/poll.(*FD).Read+0x189			/home/rokety/Software/go/src/internal/poll/fd_unix.go:126
#	0x563771	net.(*netFD).Read+0x51				/home/rokety/Software/go/src/net/fd_unix.go:202
#	0x575aac	net.(*conn).Read+0x6c				/home/rokety/Software/go/src/net/net.go:176
#	0x65bef4	net/http.(*connReader).Read+0x104		/home/rokety/Software/go/src/net/http/server.go:753
#	0x516a59	bufio.(*Reader).fill+0x119			/home/rokety/Software/go/src/bufio/bufio.go:97
#	0x51790b	bufio.(*Reader).ReadSlice+0x2b			/home/rokety/Software/go/src/bufio/bufio.go:338
#	0x517b73	bufio.(*Reader).ReadLine+0x33			/home/rokety/Software/go/src/bufio/bufio.go:367
#	0x5e9fcf	net/textproto.(*Reader).readLineSlice+0x6f	/home/rokety/Software/go/src/net/textproto/reader.go:55
#	0x5e9dda	net/textproto.(*Reader).ReadLine+0x2a		/home/rokety/Software/go/src/net/textproto/reader.go:36
#	0x656168	net/http.readRequest+0x98			/home/rokety/Software/go/src/net/http/request.go:925
#	0x65d1fb	net/http.(*conn).readRequest+0x17b		/home/rokety/Software/go/src/net/http/server.go:933
#	0x660ffd	net/http.(*conn).serve+0x50d			/home/rokety/Software/go/src/net/http/server.go:1739
heap 页面
展示了堆内存的详细信息,页面底部部分信息字段说明:
- NumGC:程序运行到现在的 gc 执行次数
- PauseNs:是拥有 256 个元素的环形缓冲,用于记录最近的 256 次 gc 执行的停顿时间(一次 gc 执行可能会有多次停顿,这里记录的是一次 gc 执行中总的停顿时间)
- PauseEnd:也是拥有 256 个元素的环形缓冲,用于记录最近的 256 次 gc 执行时,停顿结束的时间戳(纳秒级)(一次 gc 执行可能会有多次停顿,这里记录的是最后的一次停顿的结束时间)
- 更多字段含义可以查看:runtime.MemStats [3]
现在开始进行采样并分析,执行 go tool pprof –seconds 5 ,会将采样结果下载下来,并且打开一个交互界面:
Fetching profile over HTTP from
Please wait... (5s)
Saved profile in /home/rokety/pprof/pprof.main.samples.cpu.002.pb.gz
File: main
Type: cpu
Time: Dec 25, 2017 at 10:26pm (CST)
Duration: 5.12s, Total samples = 8.86s (173.15%)
Entering interactive mode (type "help" for commands, "o" for options)
(pprof) top
Showing nodes accounting for 3790ms, 42.78% of 8860ms total
Dropped 198 nodes (cum <= 44.30ms)
Showing top 10 nodes out of 182
 flat flat% sum% cum cum%
 2070ms 23.36% 23.36% 2170ms 24.49% syscall.Syscall /home/rokety/Software/go/src/syscall/asm_linux_amd64.s
 550ms 6.21% 29.57% 560ms 6.32% syscall.Syscall6 /home/rokety/Software/go/src/syscall/asm_linux_amd64.s
 200ms 2.26% 31.83% 380ms 4.29% regexp.(*machine).tryBacktrack /home/rokety/Software/go/src/regexp/backtrack.go
 200ms 2.26% 34.09% 200ms 2.26% runtime.epollctl /home/rokety/Software/go/src/runtime/sys_linux_amd64.s
 150ms 1.69% 35.78% 150ms 1.69% runtime._ExternalCode /home/rokety/Software/go/src/runtime/proc.go
 140ms 1.58% 37.36% 140ms 1.58% runtime.memmove /home/rokety/Software/go/src/runtime/memmove_amd64.s
 130ms 1.47% 38.83% 620ms 7.00% runtime.mallocgc /home/rokety/Software/go/src/runtime/malloc.go
 120ms 1.35% 40.18% 200ms 2.26% runtime.mapassign_faststr /home/rokety/Software/go/src/runtime/hashmap_fast.go
 120ms 1.35% 41.53% 120ms 1.35% runtime.usleep /home/rokety/Software/go/src/runtime/sys_linux_amd64.s
 110ms 1.24% 42.78% 110ms 1.24% runtime.heapBitsSetType /home/rokety/Software/go/src/runtime/mbitmap.go
(pprof) top -cum
Showing nodes accounting for 2.16s, 24.38% of 8.86s total
Dropped 198 nodes (cum <= 0.04s)
Showing top 10 nodes out of 182
 flat flat% sum% cum cum%
 0 0% 0% 8.02s 90.52% net/http.(*conn).serve /home/rokety/Software/go/src/net/http/server.go
 0.03s 0.34% 0.34% 3.53s 39.84% net/http.(*ServeMux).ServeHTTP /home/rokety/Software/go/src/net/http/server.go
 0 0% 0.34% 3.53s 39.84% net/http.serverHandler.ServeHTTP /home/rokety/Software/go/src/net/http/server.go
 0 0% 0.34% 3.35s 37.81% github.com/prashantv/go_profiling_talk/handlers.WithStats.func1 /home/rokety/Learn/golang/src/github.com/prashantv/go_profiling_talk/handlers/stats_handler.go
 0 0% 0.34% 3.35s 37.81% net/http.HandlerFunc.ServeHTTP /home/rokety/Software/go/src/net/http/server.go
 0.01s 0.11% 0.45% 2.38s 26.86% net/http.(*response).finishRequest /home/rokety/Software/go/src/net/http/server.go
 2.07s 23.36% 23.81% 2.17s 24.49% syscall.Syscall /home/rokety/Software/go/src/syscall/asm_linux_amd64.s
 0.02s 0.23% 24.04% 2.07s 23.36% bufio.(*Writer).Flush /home/rokety/Software/go/src/bufio/bufio.go
 0.01s 0.11% 24.15% 1.86s 20.99% github.com/prashantv/go_profiling_talk/handlers.getStatsTags /home/rokety/Learn/golang/src/github.com/prashantv/go_profiling_talk/handlers/stats_handler.go
 0.02s 0.23% 24.38% 1.80s 20.32% net/http.(*conn).readRequest /home/rokety/Software/go/src/net/http/server.go
top 默认显示 10 个占用 CPU 时间最多的函数,top -cum 则显示 10 个占用 CPU 时间(包括其调用的子函数)最多的函数。
使用 web 命令可以在浏览器打开一张 SVG 图,能够更好地看到函数调用 CPU 占用情况(web依赖 Graphviz,没有的话安装下 sudo apt-get install graphviz):
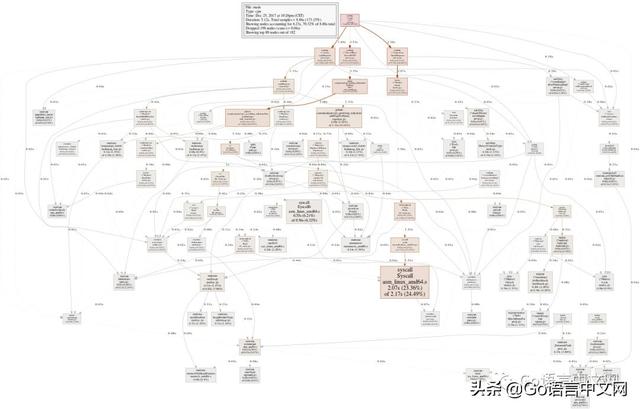
图有点大(点击上图可打开 svg 图片),以如下方块为例:
- net/http(*ServeMux)ServeHTTP server.go:调用的函数
- 0.03s(0.34%):表示函数本身执行了 0.03s,占总采样时间 8.86s 的 0.34%
- 3.53(39.84%):表示函数本身执行时间+调用的子函数的执行时间用了 3.53s,占总采样时间的 39.84%
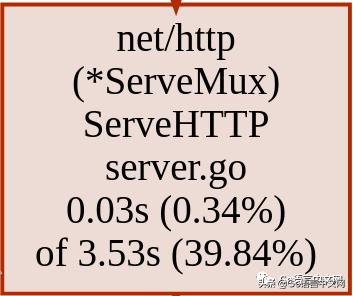
还可以使用另外一个工具,来生成火焰图,~/Software/go-app/bin/go-torch –seconds 5 :
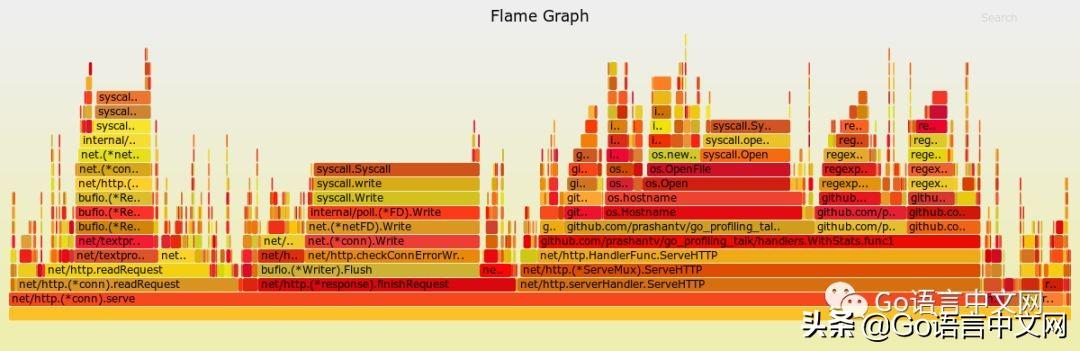
(点击上图可打开 svg 图片),火焰图怎么看?首先找与业务逻辑代码相关的且占用 CPU 时间最多的函数,可以看到github.com/prashantv/go_profiling_talk/handlers.WithStats.func1用于获取统计信息的函数占用了不少 CPU 时间,点击该函数可以看到其调用栈的更详细信息:
现在可以看到github.com/prashantv/go_profiling_talk/handlers.getStatsTags->os.Hostname的调用是占最多 CPU 时间的,看下对应的代码:
func getStatsTags(r *http.Request) map[string]string {
	userBrowser, userOS := parseUserAgent(r.UserAgent())
	stats := map[string]string{
		"browser": userBrowser,
		"os": userOS,
		"endpoint": filepath.Base(r.URL.Path),
	}
	host, err := os.Hostname()
	if err == nil {
		if idx := strings.IndexByte(host, '.'); idx > 0 {
			host = host[:idx]
		}
		stats["host"] = host
	}
	return stats
}
os.Hostname在每次请求都会被调用,然而 hostname 不会变化得很频繁,所以我们可以改下代码,对应的 commit [4] 。
看下修改后的性能如何,增加了 3000+qps:
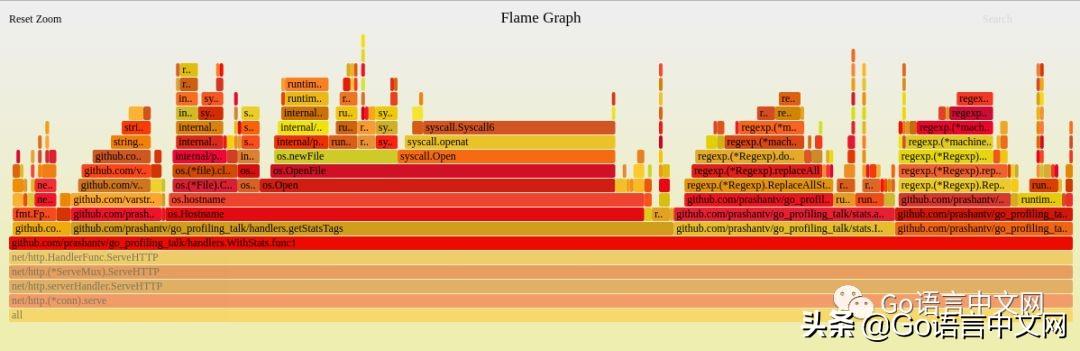
现在,重新生成火焰图看下,继续找与业务逻辑代码相关的且占用 CPU 时间最多的函数:

这次我们可以看到github.com/prashantv/go_profiling_talk/stats.addTagsToName->github.com/prashantv/go_profiling_talk/stats.clean占用许多 CPU 时间,看下对应的代码:
func addTagsToName(name string, tags map[string]string) string {
	// The format we want is: host.endpoint.os.browser
	// if there's no host tag, then we don't use it.
	var keyOrder []string
	if _, ok := tags["host"]; ok {
		keyOrder =  append (keyOrder, "host")
	}
	keyOrder = append(keyOrder, "endpoint", "os", "browser")
	parts := []string{name}
	for _, k := range keyOrder {
		v, ok := tags[k]
		if !ok || v == "" {
			parts = append(parts, "no-"+k)
			continue
		}
		parts = append(parts, clean(v))
	}
	return strings.Join(parts, ".")
}
var specialChars = regexp.MustCompile(`[{}/\\:\s.]`)
// clean takes a string that may contain special characters, and replaces these
// characters with a '-'.
func clean(value string) string {
	return specialChars.ReplaceAllString(value, "-")
}
在clean函数中使用了正则替换,将 {}/\\:\s. 字符替换为 -。
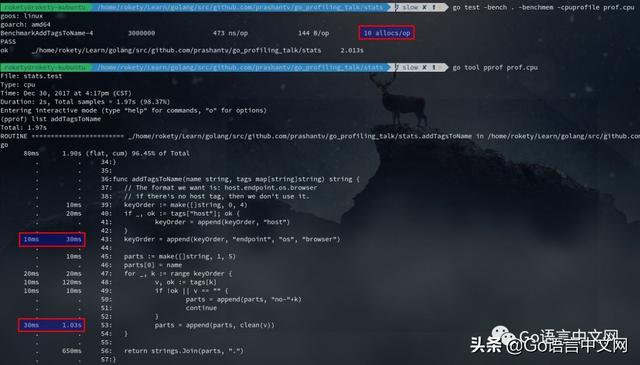
我们还可以通过go pprof查看上面两个函数的执行情况,首先写好 Benchmark 测试用例,对应的commit [5] ,然后执行go test -bench . -benchmem -cpuprofile prof.cpu,该命令会产生 CPU 的分析文件prof.cpu。

执行go tool pprof prof.cpu,然后看下addTagsToName函数的执行情况:
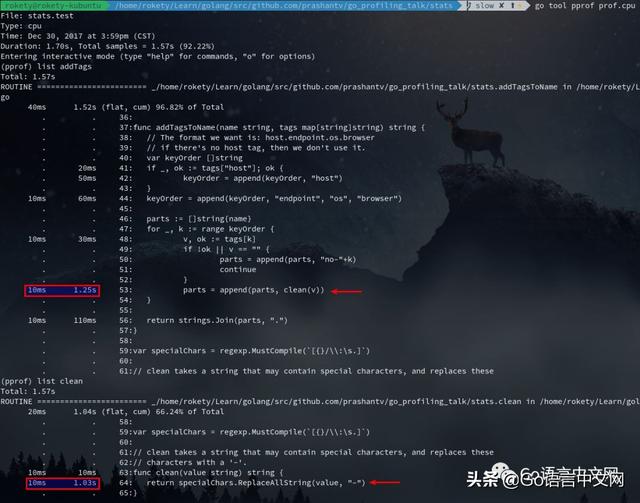
上图红框中的 10ms 是指某一次采样时,addTagsToName正好处于调用栈顶,每采样一次的时间间隔是 10ms。(When CPU profiling is enabled, the Go program stops about 100 times per second and records a sample consisting of the program counters on the currently executing goroutine’s stack.——Profiling Go Programs [6] )你可以发现列出来的时间全都是 10ms 的整数倍。现在我们可以看出占用 CPU 时间最多的就是clean函数里的正则替换。
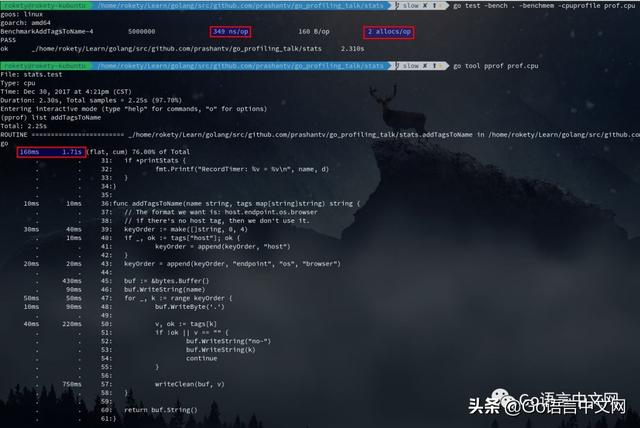
将正则替换改为字符替换,对应的commit [7] ,再次执行 benchmark:

如下图,从top可以看出红框中的runtime.*的调用占用最多 CPU,从list clean也可以看出make()和string()占用了许多 CPU:
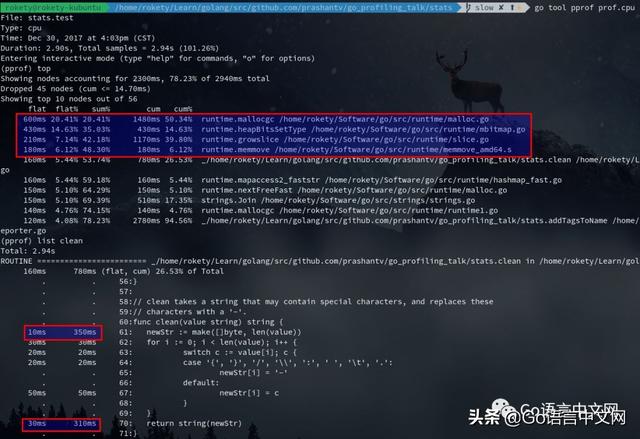
我们还可以看下clean的汇编结果:
(pprof) disasm clean
Total: 2.94s
ROUTINE ======================== _/home/rokety/Learn/golang/src/github.com/prashantv/go_profiling_talk/stats.clean
 160ms 780ms (flat, cum) 26.53% of Total
																……
				. 340ms 4ee07b: CALL runtime.makeslice(SB) ;_/home/rokety/Learn/golang/src/github.com/prashantv/go_profiling_talk/stats.clean reporter.go:61
																……
				. 280ms 4ee119: CALL runtime.slicebytetostring(SB) ;_/home/rokety/Learn/golang/src/github.com/prashantv/go_profiling_talk/stats.clean reporter.go:70
																……
(……表示省略了部分输出结果)从汇编结果中可以看出runtime.makeslice和runtime.slicebytetostring占用的 CPU 时间多,然而这里并没有我们能优化的,我们再看下addTagsToName:
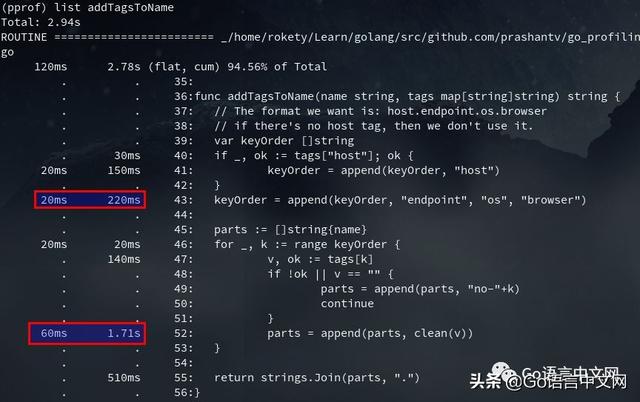
append占用了不少 CPU 时间的,主要由于 slice 的扩容,我们可以看下addTagsToName的汇编确认下:
(pprof) disasm addTagsToName
Total: 2.94s
ROUTINE ======================== _/home/rokety/Learn/golang/src/github.com/prashantv/go_profiling_talk/stats.addTagsToName
 120ms 2.78s (flat, cum) 94.56% of Total
 ……
 . 870ms 4ede3b: CALL runtime.growslice(SB) ;_/home/rokety/Learn/golang/src/github.com/prashantv/go_profiling_talk/stats.addTagsToName reporter.go:52
 ……
 . 200ms 4edf65: CALL runtime.growslice(SB) ;_/home/rokety/Learn/golang/src/github.com/prashantv/go_profiling_talk/stats.addTagsToName reporter.go:43
 ……
 . 130ms 4edfb1: CALL runtime.growslice(SB) ;_/home/rokety/Learn/golang/src/github.com/prashantv/go_profiling_talk/stats.addTagsToName reporter.go:41
从addTagsToName的代码逻辑中可以分析出,我们可以通过 make 创建好需要的 slice 容量,此优化对应的commit [8] ,优化后 append 操作占用的 CPU 时间下降了不少:

addTagsToName返回值是将一个 slice 通过 join 后得到的 string,那么这里可以考虑使用bytes.Buffer来代替 slice,看看是否能带来一些性能提升,此优化对应的commit [9] :
从上图看出,list addTagsToName性能提升并不明显,但 Benchmark 的结果可以发现ns/op和allocs/op,以及执行的次数都有所提升,在 Benchmark 这种大压力执行下,整体性能提升不少。
现在来看还有 2 个 allocs,执行go test -bench . -benchmem -memprofile prof.mem看下内存分析结果:
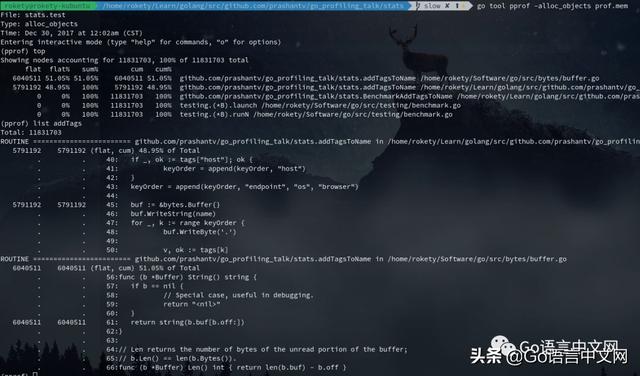
从上图可以看到 2 个 allocs,一个在 buffer.go 中,这个我们没法优化掉,一个在 addTagsToName 中,是给bytes.Buffer分配内存,这个是否可以优化掉呢?Golang 提供了 sync.Pool 可以用来缓存对象,尝试下是否能够得到性能提升,对应的代码修改如下:
var bufPool = sync.Pool{
	New: func() interface{} {
		return &bytes.Buffer{}
	},
}
func addTagsToName(name string, tags map[string]string) string {
	// The format we want is: host.endpoint.os.browser
	// if there's no host tag, then we don't use it.
	keyOrder := make([]string, 0, 4)
	if _, ok := tags["host"]; ok {
		keyOrder = append(keyOrder, "host")
	}
	keyOrder = append(keyOrder, "endpoint", "os", "browser")
	 buf := bufPool.Get().(*bytes.Buffer)
	 defer bufPool.Put(buf)
	 buf.Reset()
	//buf := &bytes.Buffer{}
	buf.WriteString(name)
	for _, k := range keyOrder {
		buf.WriteByte('.')
		v, ok := tags[k]
		if !ok || v == "" {
			buf.WriteString("no-")
			buf.WriteString(k)
			continue
		}
		writeClean(buf, v)
	}
	return buf.String()
}
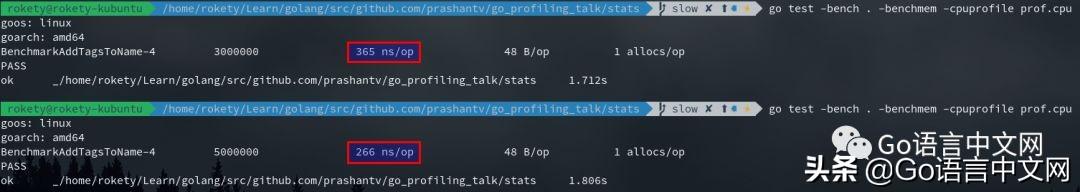
执行下 Benchmark,可以发现ns/op增加了一点,这个其实主要是因为 defer 的执行也会占用不少 CPU,改为不使用 defer,对比 Benchmark 结果,ns/op下降了一些:
然而,上面的优化(使用 sync.Pool 和不使用 defer)所带来的性能提升并不明显,反而增加了代码的维护成本,所以最终实现的代码是这样子的commit [10] 。
目前优化就到此结束了,来看下优化后的性能表现如何:
命令总结
1、进行 5 秒钟的 CPU 性能采样并打开一个交互界面:go tool pprof -seconds 5
- topN:显示 N 个占用 CPU 时间最多的函数
- topN -cum:显示 N 个占用 CPU 时间(包括其调用的子函数)最多的函数
- list regex:显示与正则 regex 匹配的函数的代码
- disasm regex:显示与正则 regex 匹配的函数的汇编代码
2、进行压力测试并产生 CPU 和内存分析文件:go test -bench . -benchmem -cpuprofile prof.cpu -memprofile prof.mem
3、打开 CPU 分析文件:go tool pprof prof.cpu
4、打开内存分析文件:go tool pprof -alloc_objects stats.test prof.mem
5、进行 5 秒钟的 CPU 性能采样并生成火焰图:go-torch –seconds 5
6、从 CPU 分析文件中生成火焰图:go-torch –binaryname stats.test -b prof.cpu
7、显示内联函数,逃逸分析情况:go build -gcflags=-m .
性能分析总结
- 不要过早的优化:Go 提供了非常便捷的方式帮助我们分析代码,无论是通过本地的压测还是在生产环境。go-torch 能帮助你找到热点的函数。
- 减少在热点路径上的内存分配:为热点路径编写压测用例。使用-benchmem 和内存分析找到在哪里发生了内存分配,并尽量优化掉。一个内存分配意味着一个可能的 GC,GC 会增加请求的延迟。
- 不要害怕查看汇编代码:有时内存分配和时间消耗不能清晰地从我们的代码里看出来,那就尝试看下汇编结果,通常你能从中找到导致内存分配和时间消耗的函数(例如 runtime.convI2E)。
文中链接
[1]Profiling and Optimizing Go:
[2]PPT:
[3]runtime.MemStats: #MemStats
[4]commit:
[5]commit:
[6]Profiling Go Programs:
[7]commit:
[8]commit:
[9]commit:
[10]commit: