最近在做 java 8 到 Java17 的迁移工作,前期做了一些准备,过程中的一些信息记录如下(持续更新。。。)
[toc]
分为几个部分:
- 编译相关
- 参数迁移相关
- 运行相关
编译相关
编译不过基本是都是使用 java 内部的 api,我列举几个常见的问题
使用了 sun.misc.* 下的包
比如 sun.misc.BASE64Encoder
 [ERROR]   symbol:   class BASE64Encoder
[ERROR]   location: package sun.misc
这个简单,替换一下工具类即可。
lombok 使用了 com.sun.tools. javac .* 下的包
错误信息如下:
Failed to execute goal org.apache.maven.plugins:maven-compiler-plugin:3.2:compile (default-compile) on project encloud-common: Fatal error compiling: java.lang. exception InInitializerError: Unable to make field private com.sun.tools.javac.processing.JavacProcessingEnvironment$DiscoveredProcessors com.sun.tools.javac. process ing. Java cProcessingEnvironment.discoveredProcs accessible: module jdk.compiler does not "opens com.sun.tools.javac.processing" to unnamed module
如果你的项目中使用 lombok,而且是低版本的话,就会出现,lombok 的原理是在编译期做一些手脚,用到了 com.sun.tools.javac 下的文件,升级到最新版可以解决。ps,个人很不喜欢 lombok, 调试的时候代码和 class 对不上真的很恶心。
 <dependency>
    <groupId>org.projectlombok</groupId>
    <artifac tid >lombok</artifactId>
   <!-- <version>1.16.4</version>-->
    <version>1.18.24</version>
</dependency>
netty 低版本使用了 sun.misc.*
错误信息如下
 Caused by: java.lang.NoClassDefFoundError: Could not initialize class io.netty.util.internal.PlatformDependent0
        at io.netty.util.internal.PlatformDependent.getSystemClassLoader(PlatformDependent.java:694) ~[netty-all-4.0.42.Final.jar!/:4.0.42.Final]
对应的源码如下:
 /**
 * The {@link PlatformDependent} operations which requires access to {@code sun.misc.*}.
 */final class PlatformDependent0 {
}
代码中用到了 javax . annotation .*下的包
比如
 import javax.annotation.PreDestroy;
public  abstract  class FridayAgent
    @PreDestroy
    public  void  destroy() {
        agentClient.close();
    }
}
这是因为 Java EE 已经在 Java 9 中被标记为 deprecated,Java 11 中被正式移除。可以手动引入 javax 的包
 <dependency>
    <groupId>javax.annotation</groupId>
    <artifactId>javax.annotation-api</artifactId>
    <version>1.3.2</version>
</dependency>
Kotlin 版本限制
[ERROR] Failed to execute goal org.jetbrains.kotlin:kotlin-maven-plugin:1.2.71:compile (compile) on project encloud-core: Compilation failure
[ERROR] Unknown jvm target version: 17 [ERROR] Supported versions: 1.6, 1.8
Kotlin 在 1.6.0 版本开始支持 Java17 的字节码,低于 1.6.0 的编译会直接报错
参数迁移
什么是 Unified Logging
在 Java 领域,有广为人知的日志框架, slf4j 、 log4j 等,这些框架提供了统一的编程接口,让用户可以通过简单的配置实现日志输出的个性化配置,比如日志 tag、级别(info、debug 等)、上下文( 线程 id、行号、时间等),在 JVM 内部之前一直缺乏这样的规范,于是出来了 Unified Logging,实现了日志格式的大一统,这就是我们接下来要介绍的重点 Unified Logging 。
我们接触最多的是 gc 的日志,在 java8 中,我们配置 gc 日志的参数是 -Xloggc:/tmp/gc.log 。在 JVM 中除了 GC,还有大量的其它相关的日志,比如线程、os 等,在新的 Unified Logging 日志中,日志输出的方式变更为了 java -Xlog:xxx ,GC 不再特殊只是做为日志的一种存在形式。
java -Xlog -version 输出结果如下:
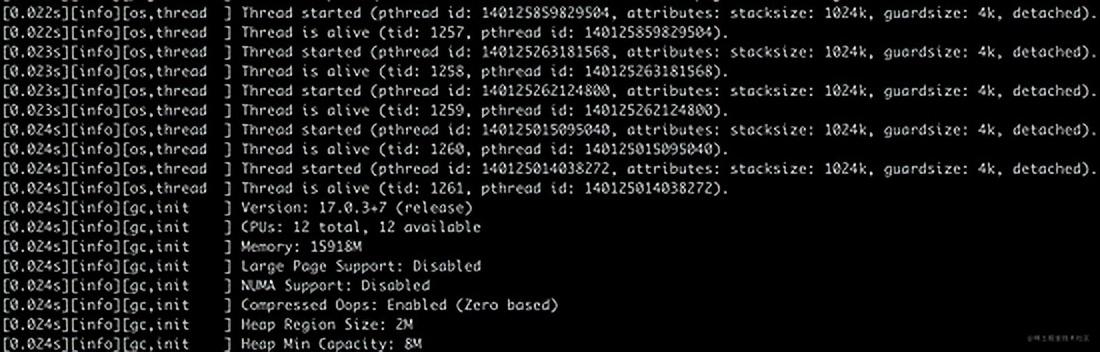
可以看到日志输出里,不仅有 GC 相关的日志,还有 os 线程相关的信息。事实上 java 的日志的生产者有非常多部分,比如 thread、class load、unload、safepoint、cds 等。

归根到底,日志打印,需要回答清楚三个问题:
- what:要输出什么信息(tag),以什么日志级别输出(level)
- where:输出到哪里(console 还是 File )
- decorators:日志如何
输出什么信息(selectors)
首先来看 what 的部分,如何指定要输出哪些信息,这个在 JVM 内部被称之为 selectors。
JVM 采用的是 <tag-set>=<level> 的形式来表示 selectors,默认情况下,tag 为 all ,表示所有的 tag,level 为 INFO , java -Xlog -version 等价于下面的形式
java -Xlog:all=info -version 如果我们想输出tag 为 gc,日志级别为 debug 的日志,可以用 java -Xlog:gc=debug 的形式:
 $ java -Xlog:gc=debug -version
[0.023s][info][gc] Using G1
[0.023s][debug][gc] ConcGC thread s: 3 offset 22
[0.023s][debug][gc] ParallelGCThreads: 10
[0.024s][debug][gc] Initialize mark stack with 4096 chunks, maximum 524288
这样就输出了 tag 为 gc,级别为 debug 的日志信息。
不过这里有一个比较坑的点是,这里的 tag 匹配规则是精确匹配,如果某条日志的 tag 是 gc,metaspace ,通过上面的规则是匹配不到的,我们可以手动指定的方式来输出。
 $ java -Xlog:gc+metaspace -version

[0.022s][info][gc,metaspace] CDS archive(s) mapped at: ... size 12443648.
[0.022s][info][gc,metaspace] Compressed class space mapped at: reserved size:...
[0.022s][info][gc,metaspace] Narrow klass base:..., Narrow
klass shift: 0, Narrow klass range: 0x100000000
这里的 selector 也是可以进行组合的,不同的 selector 之间用逗号分隔即可。比如同时输出 gc 和 gc+metaspace 这两类 tag 的日志,就可以这么写:
$ java -Xlog:gc=debug,gc+metaspace -version
[0.020s][info][gc] Using G1
[0.020s][debug][gc] ConcGCThreads: 3 offset 22
[0.020s][debug][gc] ParallelGCThreads: 10
[0.020s][debug][gc] Initialize mark stack with 4096 chunks, maximum 524288
[0.022s][info ][gc,metaspace] CDS archive(s) mapped at:
[0.022s][info ][gc,metaspace] Compressed class space mapped at:
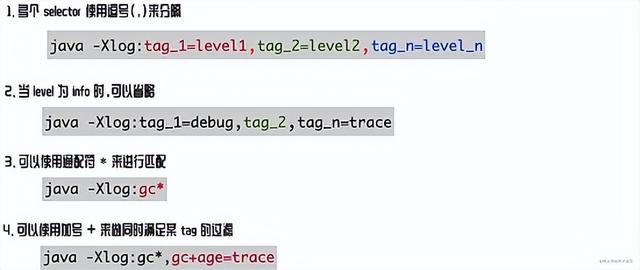
[0.022s][info ][gc,metaspace] Narrow klass base: 0x0000000800000000 当然这么搞是很麻烦的,JVM 提供了 通配符 * 来解决精确匹配的问题,比如我们想要所有 tag 为 gc 的日志,可以这么写:
 $ java -Xlog:gc*=debug -version

[0.024s][debug][gc,heap] Minimum heap 8388608
[0.024s][info ][gc     ] Using G1
[0.024s][debug][gc,heap,coops] Heap address: 0x0000000707400000
[0.024s][debug][gc           ] ConcGCThreads: 3 offset 22
[0.024s][debug][gc           ] ParallelGCThreads: 10
[0.024s][debug][gc           ] Initialize mark stack with 4096 chunks
[0.024s][debug][gc,ergo,heap ] Expand the heap. requested expansion amount:
[0.025s][debug][gc,heap,region] Activate regions [0, 125)
[0.025s][debug][gc,ihop       ] Target occupancy update: old: 0B, new: 262144000B
[0.025s][debug][gc,ergo,refine] Initial Refinement Zones: green: 2560
[0.026s][debug][gc,task       ] G1 Service Thread
[0.026s][debug][gc,task       ] G1 Service Thread (Periodic GC Task) (register)
[0.026s][info ][gc,init       ] Version: 17.0.3+7 (release)
...
如果只想要 INFO 级别的日志,则可以省略 level 的设置,使用 java -Xlog:gc* -version 即可。
如果想知道有哪些个性化的 tag 可以选择,可以用 java -Xlog:help 来找到所有可用的 tag。
阶段性小结
第二部分:输出到哪里(output)
默认情况下,日志会输出到 stdout ,jvm 支持以下三种输出方式:
- stdout
- stderr
- file
一般而言我们会把日志输出到文件中,方便后续进一步分析
-Xlog:all=debug:file=/path_to_logs/app.log 还可以指定日志切割的大小和方式
-Xlog:gc*:file=/path_to_logs/app.log:filesize=104857600,filecount=5 第三部分:日志 decorators
每条日志除了正常的信息以外,还有不少日志相关的上下文信息,在 jvm 中被称为 decorators ,有下面这些可选项。
Option | Description |
time | Current time and date in ISO-8601 format. |
uptime | Time since the start of the JVM in seconds and milliseconds (e.g., 6.567s). |
timemillis | The same value as generated by System.currentTimeMillis(). |
uptimemillis | Milliseconds since the JVM started. |
timenanos | The same value as generated by System.nanoTime(). |
uptimenanos | Nanoseconds since the JVM started. |
pid | The process identifier. |
tid | The thread identifier. |
level | The level associated with the log message. |
tags | The tag-set associated with the log message. |
比如可以用 java -Xlog:all=debug:stdout:level,tags,time,uptime,pid -version 选项来打印日志。
 [2022-06-15T19:54:01.529+0800][0.001s][5235][info ][os,thread] Thread attached
[2022-06-15T19:54:01.529+0800][0.001s][5235][debug][os,thread] Thread 5237 stack...
[2022-06-15T19:54:01.529+0800][0.001s][5235][debug][perf,datacreation]
Unified Logging 小结
输出格式如下:
-Xlog:[selectors]:[output]:[decorators][:output-options]
tag1[+tag2...][*][=level][,...]
这里补充一个知识点,就是默认值:
- tag:all
- level:info
- output:stdout
- decorators: uptime, level, tags
GC 参数迁移
可以看到 GC 相关的参数都已经收拢到 Xlog 下,以前的很多 Java8 下的参数已经被移除或者标记为过期。
比如 PrintGCDetails 已经被 -Xlog:gc* 取代:
 java -XX:+PrintGCDetails -version

[0.001s][warning][gc] -XX:+PrintGCDetails is deprecated. Will use -Xlog:gc* instead.
常见的标记为废弃的参数还有 -XX:+PrintGC 和 -Xloggc:<filepath> ,迁移前后的参数如下:
旧参数 | 新参数 |
-XX:+PrintGCDetails | -Xlog:gc* |
-XX:+PrintGC | -Xlog:gc |
-Xloggc: <filepath> | -Xlog:gc: file=<filepath> |
除此之外,大量的 GC 的参数被移除,比如常用的参数 -XX:+PrintTenuringDistribution ,Java17 会拒绝启动
 java -XX:+PrintTenuringDistribution -version
Unrecognized VM option 'PrintTenuringDistribution'
Error: Could not create the Java Virtual Machine.
Error: A fatal exception has occurred. Program will exit.
更详细的移除的参数如下
 CMSDumpAtPromotionFailure,
CMSPrintEdenSurvivorChunks,
GlLogLevel,
G1PrintHeapRegions,
G1PrintRegionLivenessInfo,
G1SummarizeConcMark,
G1SummarizeRSetStats,
G1TraceConcRefinement,
G1TraceEagerReclaimHumongousObjects,
G1TraceStringSymbolTableScrubbing,
GCLogFileSize, NumberofGCLogFiles,
PrintAdaptiveSizePolicy,
PrintclassHistogramAfterFullGC,
PrintClassHistogramBeforeFullGC,
PrintCMSInitiationStatistics
PrintCMSStatistics,
PrintFLSCensus,
PrintFLSStatistics,
PrintGCApplicationConcurrentTime
PrintGCApplicationStoppedTime,
PrintGCCause,
PrintGCDateStamps,
PrintGCID,
PrintGCTaskTimeStamps,
PrintGCTimeStamps,
PrintHeapAtGC,
PrintHeapAtGCExtended,
PrintJNIGCStalls,
PrintOldPLAB
PrintParallel0ldGCPhaseTimes,
PrintPLAB,
PrintPromotionFailure,
PrintReferenceGC,
PrintStringDeduplicationStatistics,
PrintTaskqueue,
PrintTenuringDistribution,
PrintTerminationStats,
PrintTLAB,
TraceDynamicGCThreads,
TraceMetadataHumongousAllocation,
UseGCLogFileRotation,
VerifySilently
这些移除的参数大部分都能在新的日志体系下找到对应的参数,比如 PrintHeapAtGC 这个参数可以用 -Xlog:gc+heap=debug 来替代
 $ java -Xlog:gc+heap=debug -cp . G1GCDemo01

[0.004s][debug][gc,heap] Minimum heap 8388608  Initial heap 268435456  Maximum heap
hello, g1gc!
[12.263s][debug][gc,heap] GC(0) Heap before GC invocations=0 (full 0):
[12.265s][debug][gc,heap] GC(0)  garbage-first heap
[12.265s][debug][gc,heap] GC(0)   region size 2048K, 1 young (2048K)
[12.265s][debug][gc,heap] GC(0)  Metaspace       used 3678K
[12.265s][debug][gc,heap] GC(0)   class space    used 300K
[12.280s][debug][gc,heap] GC(0) Uncommittable regions after shrink: 124
虽然理解起来不太直观,不过要记住 -XX:+PrintGCApplicationStoppedTime 和 -XX+PrintGCApplicationConcurrentTime 这两个参数一起被 -Xlog:safepoint 取代。
还有一个常见的参数 -XX:+PrintAdaptiveSizePolicy 被 -Xlog:gc+ergo*=trace 取代,
[0.122s][debug][gc, ergo, refine] Initial Refinement Zones: green: 23, yellow:
69, red: 115, min yellow size: 46
[0.142s ][debug][gc, ergo, heap ] Expand the heap. requested expansion amount: 268435456B expansion amount: 268435456B
[2.475s][trace][gc, ergo, cset
] GC(0) Start choosing CSet. pending cards: 0 predicted base time: 10.00ms remaining time:
190.00ms target pause time: 200.00ms
[2.476s][trace][gc, ergo, cset ] GC(9) Add young regions to CSet. eden: 24 regions, survivors: 0 regions, predicted young
region time: 367.19ms, target pause time: 200.00ms
[2.476s ][debug][gc, ergo, cset ] GC(0) Finish choosing CSet. old: 0 regions, predicted old region time: 0.00ms, time
remaining: 0.00
[2.826s][debug][gc, ergo
] GC(0) Running G1 Clear Card Table Task using 1 workers for 1 units of work for 24 regions.
[2.827s][debug][gc, ergo
] GC (0) Running G1 Free Collection Set using 1 workers for collection set length 24
[2.828s][trace][gc, ergo, refine] GC(0) Updating Refinement Zones: update rs time: 0.004ms, update rs buffers: 0, update rs
goal time: 19.999ms
[2.829s][debug][gc, ergo, refine] GC(0) Updated Refinement Zones: green: 23, yellow: 69, red: 115
[3.045s][trace][gc, ergo, set ] GC(1) Start choosing CSet. pending cards: 5898 predicted base time: 26.69ms remaining
time: 173.31ms target pause time: 200.00ms
[3.045s][trace][gc, ergo, cset ] GC(1) Add young regions to Set. eden: 9 regions, survivors: 3 regions, predicted young
region time: 457.38ms, target pause time: 200.00ms
[3.045s][debug](gc, ergo, set ] GC(1) Finish choosing CSet. old: @ regions, predicted old region time: 0.00ms, time
remaining: 0.00
[3.090s ][debug][gc, ergo
] GC (1) Running G1 Clear Card Table Task using 1 workers for 1 units of work for 12 regions.
[3.091s][debug][gc, ergo
GC (1) Running G1 Free Collection Set using 1 workers for collection set length 12
[3.093s][trace][gc, ergo, refine] GC(1) Updating Refinement Zones: update rs time: 2.510ms, update rs buffers: 25, update rs
goal time: 19.999ms
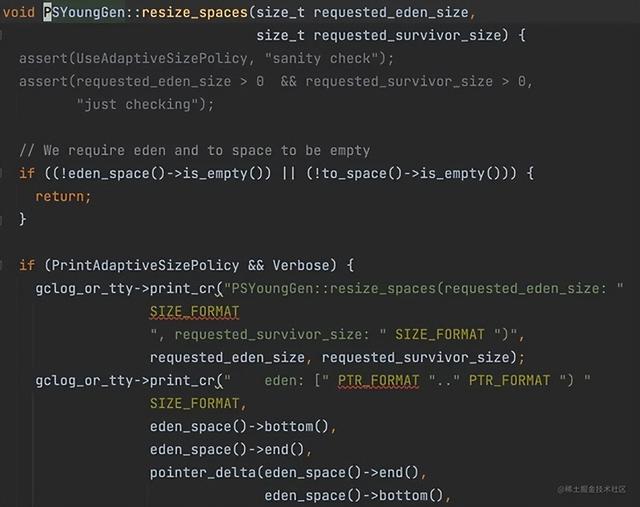
[3.093s ][debug][gc, ergo, refine] GC(1) Updated Refinement Zones: green: 25, yellow: 75, red: 125 看一下这部分的源码的变迁,就可以知道确实是如此了,在 Java8 中, PSYoungGen::resize_spaces 代码如下:
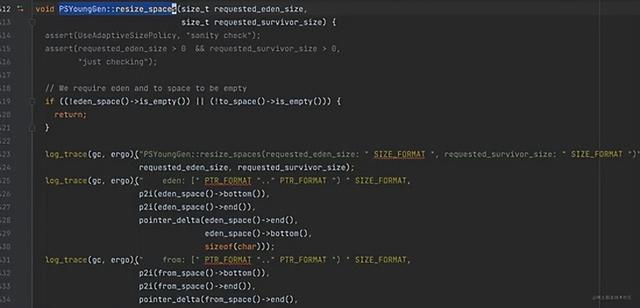
在 Java17 中,这部分日志打印被 gc+ergo 的标签日志取代:
还有一个分代 GC 中非常有用的参数 -XX:+PrintTenuringDistribution ,现在被 gc+age=trace 取代
完整的参数变迁对应表如下:
旧 GC 参数 -XX:+… | 对应新 GC 参数 | GC 参数含义 |
PrintGC -Xloggc: | gc | Print message at garbage collection |
PrintGCDetails -Xloggc: | gc* | Print more details at garbage collection |
-verbose:gc | gc=trace gc+heap=trace gc+heap+exit=trace gc+metaspace=trace gc+sweep=debug gc+heap+ergo=debug | Verbose GC |
PrintGCCause | GC cause is now always logged | Include GC cause in GC logging |
PrintGCID | GC ID is now always logged | Print an identifier for each garbage collection |
PrintGCApplicationStoppedTime | safepoint | Print the time the application has been stopped |
PrintGCApplicationConcurrentTime | safepoint | Print the time the application has been running |
PrintTenuringDistribution | gc+age*=trace | Print tenuring age information |
PrintAdaptiveSizePolicy | gc+ergo*=trace | Print information about AdaptiveSizePolicy |
PrintHeapAtGC | gc+heap=debug | Print heap layout before and after each GC |
PrintHeapAtGCExtended | gc+heap=trace | Print extended information about the layout of the heap when -XX:+PrintHeapAtGC is set |
PrintClassHistogramBeforeFullGC | classhisto*=trace | Print a class histogram before any major stop-world GC |
PrintClassHistogramAfterFullGC | classhisto*=trace | Print a class histogram after any major stop-world GC |
PrintStringDeduplicationStatistics | gc+stringdedup*=debug | Print string deduplication statistics |
PrintJNIGCStalls | gc+jni=debug | Print diagnostic message when GC is stalled by JNI critical section |
PrintReferenceGC | gc+ref=debug | Print times spent handling reference objects during GC |
PrintGCTaskTimeStamps | task*=debug | Print timestamps for individual gc worker thread tasks |
PrintTaskQueue | gc+task+stats=trace | Print taskqueue statistics for parallel collectors |
PrintPLAB | gc+plab=trace | Print (survivor space) promotion LAB’s sizing decisions |
PrintOldPLAB | gc+plab=trace | Print (old gen) promotion LAB’s sizing decisions |
PrintPromotionFailure | gc+promotion=debug | Print additional diagnostic information following promotion failure |
PrintTLAB | gc+tlab=trace | Print various TLAB related information (augmented with -XX:+TLABStats) |
PrintTerminationStats | gc+task+stats=debug | Print termination statistics for parallel collectors |
G1PrintHeapRegions | gc+region=trace | If set G1 will print information on which regions are being allocated and which are reclaimed |
G1PrintRegionsLivenessInfo | gc+liveness=trace | Prints the liveness information for all regions in the heap at the end of a marking cycle |
G1SummarizeConcMark | gc+marking=trace | Summarize concurrent mark info |
G1SummarizeRSets | gc+remset*=trace | Summarize remembered set processing info |
G1TraceConcRefinement | gc+refine=debug | Trace G1 concurrent refinement |
G1TraceEagerReclaimHumongousObjects | gc+humongous=debug | Print some information about large object liveness at every young GC |
G1TraceStringSymbolTableScrubbing | gc+stringdedup=trace | Trace information string and symbol table scrubbing |
PrintParallelOldGCPhaseTimes | gc+phases=trace | Print the time taken by each phase in ParallelOldGC |
CMSDumpAtPromotionFailure | gc+promotion=trace | Dump useful information about the state of the CMS old generation upon a promotion failure (complemented by flags CMSPrintChunksInDump or CMSPrintObjectsInDump) |
CMSPrintEdenSurvivorChunks | gc+heap=trace | Print the eden and the survivor chunks used for the parallel initial mark or remark of the eden/survivor spaces |
PrintCMSInitiationStatistics | gc=trace | Statistics for initiating a CMS collection |
PrintCMSStatistics | gc=debug (trace) gc+task=trace gc+survivor=trace log+sweep=debug (trace) | Statistics for CMS (complemented by CMSVerifyReturnedBytes) |
PrintFLSCensus | gc+freelist+census=debug | Census for CMS’ FreeListSpace |
PrintFLSStatistics | gc+freelist+stats=debug (trace) gc+freelist*=debug (trace) | Statistics for CMS’ FreeListSpace |
TraceCMSState | gc+state=debug | Trace the state of the CMS collection |
TraceSafepoint | safepoint=debug | Trace application pauses due to VM operations in safepoints |
TraceSafepointCleanupTime | safepoint+cleanup=info | break down of clean up tasks performed during safepoint |
TraceAdaptativeGCBoundary | heap+ergo=debug | Trace young-old boundary moves |
TraceDynamicGCThreads | gc+task=trace | Trace the dynamic GC thread usage |
TraceMetadataHumongousAllocation | gc+metaspace+alloc=debug | Trace humongous metadata allocations |
VerifySilently | gc+verify=debug |
|
举例
 -XX:+PrintGCDetails                             // gc*
-XX:+PrintGCApplicationStoppedTime              // safepoint
-XX:+PrintGCApplicationConcurrentTime           // safepoint
-XX:+PrintGCCause                               // 默认会输出
-XX:+PrintGCID                                  // 默认会输出
-XX:+PrintTenuringDistribution                  // gc+age*=trace
-XX:+PrintGCDateStamps                          // :time,tags,level
-XX:+UseGCLogFileRotation                       // :filecount=5,filesize=10M
-XX:NumberOfGCLogFiles=5                        // :filecount=5,filesize=10M
-XX:GCLogFileSize=10M                           // :filecount=5,filesize=10M
-Xloggc:/var/log/`date +%FT%H-%M-%S`-gc.log     // -Xlog::file=/var/log/%t-gc.log
变迁后:
 -Xlog:
  gc*,
  safepoint,
  gc+heap=debug,
  gc+ergo*=trace,
  gc+age*=trace,
  :file=/var/log/%t-gc.log
  :time,tags,level
  :filecount=5,filesize=10M
推荐的配置
 -Xlog:
// selections
    codecache+sweep*=trace,
    class+unload,                      // TraceClassUnloading
    class+load,                        // TraceClassLoading
    os+thread,
    safepoint,                        // TraceSafepoint
    gc*,                              // PrintGCDetails
    gc+stringdedup=debug,             // PrintStringDeduplicationStatistics
    gc+ergo*=trace,
    gc+age=trace,                     // PrintTenuringDistribution
    gc+phases=trace,
    gc+humongous=trace,
    jit+compilation=debug
// output
:file=/path_to_logs/app.log
// decorators
:level,tags,time,uptime,pid
// output-options
:filesize=104857600,filecount=5
运行相关
关于 GC 算法的选择
CMS 正式退出历史舞台,G1 正式接棒,ZGC 蓄势待发。在GC 算法的选择上,目前来看 G1 还是最佳的选择,ZGC 因为有内存占用被 OS 标记过高(三倍共享内存)虚高的问题,进程可能被 OOM-killer 杀掉,接下面我们讨论的都是 G1 相关的。
不要配置新生代的大小
诸如 -Xmn, -XX:NewSize, -XX:MaxNewSize, -XX:SurvivorRatio 都不要在 G1 中出现,只需要控制最大、最小堆和目标暂停时间即可, -Xms, -Xmx and a pause time goal -XX:MaxGCPauseMillis
调整-XX:InitiatingHeapOccupancyPercent到合适的值
IHOP 默认值为 45,这个值是启动并发标记的先决条件,只有当老年代内存栈总空间的 45% 之后才会启动并发标记任务。
增加这个值:导致并发标记可能花费更多的时间,同时导致 YGC 和 Mixed-GC 收集时的分区数变少
可以根据整体应用占用的平均内存来设置,把这个值比平均内存设置得稍高一些,此时性能最好。
模块可见性导致的内部 API 不能调用的问题
Java9 之后引入了模块化的概念,将类型和资源封装在模块中,并仅导出其他模块要访问其公共类型的软件包。如果模块中的软件包未导出或打开,则表示模块的设计人员无意在模块外部使用这些软件包。这样的包可能会被修改或甚至从模块中删除,无需任何通知。 如果仍然使用这些软件包通过使用命令行选项导出或打开它们。
 Caused by: java.lang.reflect.InaccessibleObjectException: Unable to make protected final java.lang.Class java.lang.ClassLoader.defineClass(java.lang.String,byte[],int,int,java.security.ProtectionDomain) throws java.lang.ClassFormatError accessible: module java.base does not "opens java.lang" to unnamed module @78ac1102
        at java.base/java.lang.reflect.AccessibleObject.checkCanSetAccessible(AccessibleObject.java:354)
        at java.base/java.lang.reflect.AccessibleObject.checkCanSetAccessible(AccessibleObject.java:297)
        at java.base/java.lang.reflect.Method.checkCanSetAccessible(Method.java:199)
        at java.base/java.lang.reflect.Method.setAccessible(Method.java:193)
        at com.google.inject.internal.cglib.core.$ReflectUtils$1.run(ReflectUtils.java:52)
        at java.base/java.security.AccessController.doPrivileged(AccessController.java:318)
        at com.google.inject.internal.cglib.core.$ReflectUtils.<clinit>(ReflectUtils.java:42)
可以