气泡图 是一个双轴图表,为一系列数据点绘制气泡。
创建气泡图
要创建气泡图,我们创建BubbleChart类,定义水平和垂直轴,并使用添加一个或多个数据系列XYChart.Data类。
/*
 * Copyright (c) 2011, 2012 Oracle and/or its affiliates.
 * All rights reserved. Use is subject to license terms.
 *
 * This file is available and licensed under the following license:
 *
 * Redistribution and use in source and binary forms, with or without
 * modification, are permitted provided that the following conditions
 * are met:
 *
 * - Redistributions of source code must retain the above copyright
 * notice, this list of conditions and the following disclaimer.
 * - Redistributions in binary form must reproduce the above copyright
 * notice, this list of conditions and the following disclaimer in
 * the documentation and/or other materials provided with the distribution.
 * - Neither the name of Oracle nor the names of its
 * contributors may be used to endorse or promote products derived
 * from this software without specific prior written permission.
 *
 * THIS SOFTWARE IS PROVIDED BY THE COPYRIGHT HOLDERS AND CONTRIBUTORS
 * "AS IS" AND ANY EXPRESS OR IMPLIED WARRANTIES, INCLUDING, BUT NOT
 * LIMITED TO, THE IMPLIED WARRANTIES OF MERCHANTABILITY AND FITNESS FOR
 * A PARTICULAR PURPOSE ARE DISCLAIMED. IN NO EVENT SHALL THE COPYRIGHT
 * OWNER OR CONTRIBUTORS BE LIABLE FOR ANY DIRECT, INDIRECT, INCIDENTAL,
 * SPECIAL, EXEMPLARY, OR CONSEQUENTIAL DAMAGES (INCLUDING, BUT NOT
 * LIMITED TO, PROCUREMENT OF SUBSTITUTE GOODS OR SERVICES; LOSS OF USE,
 * DATA, OR PROFITS; OR BUSINESS INTERRUPTION) HOWEVER CAUSED AND ON ANY
 * THEORY OF LIABILITY, WHETHER IN CONTRACT, STRICT LIABILITY, OR TORT
 * (INCLUDING NEGLIGENCE OR OTHERWISE) ARISING IN ANY WAY OUT OF THE USE
 * OF THIS SOFTWARE, EVEN IF ADVISED OF THE POSSIBILITY OF SUCH DAMAGE.
 */
//package bubblechartsample;
import  JavaFX .application.Application;
import javafx.scene.Scene;
import javafx.scene.chart.BubbleChart;
import javafx.scene.chart. Number Axis;
import javafx.scene.chart.XYChart;
import javafx.scene.paint.Color;
import javafx.stage.Stage;
public class Main extends Application {
 @Override public void start(Stage stage) {
 stage.setTitle("Bubble Chart Sample");
 final NumberAxis xAxis = new NumberAxis(1, 53, 4);
 final NumberAxis yAxis = new NumberAxis(0, 80, 10);
 final BubbleChart<Number,Number> blc =
 new BubbleChart<Number,Number>(xAxis,yAxis);
 xAxis.setLabel("Week");
 xAxis.setTickLabelFill(Color.CHOCOLATE);
 xAxis.setMinorTickCount(4);

 yAxis.setLabel("Product Budget");
 yAxis.setTickLabelFill(Color.CHOCOLATE);
 yAxis.setTickLabelGap(10);
 yAxis.setTickLabelFormatter(
 new NumberAxis.DefaultFormatter(yAxis,"$ ",null)
 );

 blc.setTitle("Budget Monitoring");

 XYChart.Series series1 = new XYChart.Series();
 series1.setName("Product 1");
 series1.getData().add(new XYChart.Data(3, 35, 2));
 series1.getData().add(new XYChart.Data(12, 60, 1.8));
 series1.getData().add(new XYChart.Data(15, 15, 7));
 series1.getData().add(new XYChart.Data(22, 30, 2.5));
 series1.getData().add(new XYChart.Data(28, 20, 1));
 series1.getData().add(new XYChart.Data(35, 41, 5.5));
 series1.getData().add(new XY Chart .Data(42, 17, 9));
 series1.getData().add(new XYChart.Data(49, 30, 1.8));

 XYChart.Series series2 = new XYChart.Series();
 series2.setName("Product 2");
 series2.getData().add(new XYChart.Data(8, 15, 2));
 series2.getData().add(new XYChart.Data(13, 23, 1));
 series2.getData().add(new XYChart.Data(15, 45, 3));
 series2.getData().add(new XYChart.Data(24, 30, 4.5));
 series2.getData().add(new XYChart.Data(38, 78, 1));
 series2.getData().add(new XYChart.Data(40, 41, 7.5));
 series2.getData().add(new XYChart.Data(45, 57, 2));
 series2.getData().add(new XYChart.Data(47, 23, 3.8));

 Scene scene = new Scene(blc);
 blc.getData().addAll(series1, series2);
 //scene.getStylesheets().add("bubblechartsample/Chart.css");
 stage.setScene(scene);
 stage.show();
 }
 public static void main(String[] args) {
  launch (args);
 }
}
NumberAxis.DefaultFormatter类将向指定轴的标记添加前缀和后缀。
yAxis.setTickLabelFormatter(new NumberAxis.DefaultFormatter(yAxis,"$ ",null));
以下代码行指定了刻度标签的CHOCOLATE颜色。
xAxis.setTickLabelFill(Color.CHOCOLATE);
yAxis.setTickLabelFill(Color.CHOCOLATE);
例子
import javafx.application.Application;
import javafx.collections.FXCollections;
import javafx.collections.ObservableList;
import javafx.scene.Scene;
import javafx.scene.chart.BubbleChart;
import javafx.scene.chart.NumberAxis;
import javafx.scene.chart.XYChart;
import javafx.scene.chart.XYChart.Series;
import javafx.scene.layout.StackPane;
import javafx.stage.Stage;
public class Main extends Application {
 public static void main(String[] args) {
 launch(args);
 }
 @Override
 public void start(Stage primaryStage) {
 NumberAxis xAxis = new NumberAxis();
 NumberAxis yAxis = new NumberAxis();
 xAxis.setAutoRanging(false);
 xAxis.setLowerBound(2011);
 xAxis.setUpperBound(2016);
 BubbleChart bubbleChart = new BubbleChart(xAxis, yAxis);
 bubbleChart.setData(getChartData());
 bubbleChart.setTitle("Title");
 primaryStage.setTitle("Chart example");
 StackPane root = new StackPane();
 root.getChildren().add(bubbleChart);
 primaryStage.setScene(new Scene(root, 400, 250));
 primaryStage.show();
 }
 private ObservableList<XYChart.Series<Integer,  Double >> getChartData() {
 double aValue = 1.56;
 double bValue = 1.06;
 ObservableList<XYChart.Series<Integer, Double>> answer = FXCollections.observableArrayList();
 Series<Integer, Double> aSeries = new Series<Integer, Double>();
 Series<Integer, Double> bSeries = new Series<Integer, Double>();
 aSeries.setName("A");
 bSeries.setName("B");
 for (int i = 2011; i < 2016; i++) {
 double  diff  = Math.random();
 aSeries.getData().add(new XYChart.Data(i, aValue, diff));
 aValue = aValue + 10*diff - 5;
 diff = Math.random();
 bSeries.getData().add(new XYChart.Data(i, bValue, diff));
 bValue = bValue + 10*diff - 5;
 diff = Math.random();
 }
 answer.addAll(aSeries, bSeries);
 return answer;
 }
}
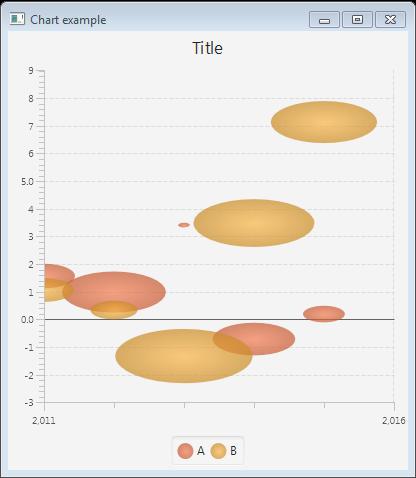
上面的代码生成以下结果。