项目目标-为什么要搭建GPE(Grafana+Prometheus+Exporter)
关注我的朋友知道,前几天开源了boot4go-gateway的项目,boot4go-gateway的http服务没有使用go net/http的原生http服务,使用的fasthttp改造后的http服务,在单一请求访问的情况下,fasthttp的性能秒杀go net/http,当然虽然go net/http性能已经比springboot系列的 tomcat 优秀不少,但是和fasthttp还是相形见绌了, 希望通过压力性能测试来对boot4go-gateway的性能以及并发负载能力进行测试,工欲善其事,必先利其器,压力测试里必不少的就是系统的监控体系,jmeter里也有机器采集的性能metrics,但是毕竟薄弱,metrics当然要选择最专业的GPE组合了。
先来看看效果图
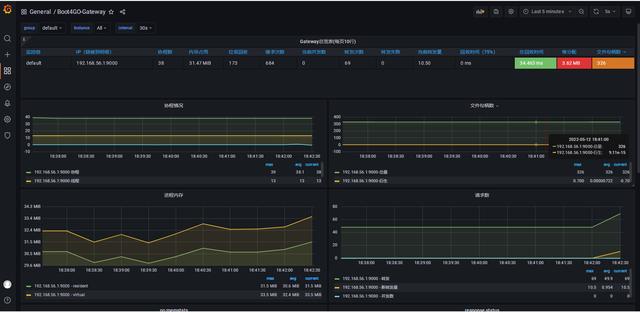
这个仪表盘展示了有关golang程序的相关metrics,包括负载量,并非数,总请求数,失败请求数,内存变化,文件句柄变化,协程数, 线程 数,GC数量,alloc数量,这些能够反映一个golang程序的当前状况的关键性指标。
如何把自己的golang集成到Prometheus里
首先要了解Prometheus的运行方式, prometheus可以看作是一个TimeSerialDB时序数据库,prometheus产品系列里的TSDB,也是一个不错的好产品, prometheus的服务端通过pull待采集端的exporter的程序,将需要采集的数据,抓取到promethues服务端来, prometheus保存到自己的TSDB里, prometheus提供自己的ql语法,进行时序数据的查询分析和统计。
所以要将golang集成到prometheus里,就是要找到合适的exporter即可。 go -prometheus的客户端包,已经包含了一些有关prometheus的 client 接口, 要把自己的golang集成到prometheus里,
下图就是prometheus里制定要进行抓取的exporter Job

动手开干, 支持fasthttp
go-prometheus支持的是标准的net/http库,golang里最有名的以快著称的是fasthttp。而prometheus没有支持fasthttp。 例如咱们的boot4go-gateway就是用fasthttp进行http服务实现的,要让fasthttp支持,就必须了解一下go-prometheus的exporter格式,自行来写了, 不过这里还好, boot4go-prometheus这个子项目,在go-prometheus的基础上,封装了fasthttp的支持, 由于是直接在go-prometheus提供的包进行封装改造的,不需要担心以后exporter协议升级的兼容问题,

如果有朋友也是用fasthttp进行开发的,可以直接使用boot4go-prometheus这个包
  import  (
prometheusfasthttp "github.com/gohutool/boot4go-prometheus/fasthttp"
)
添加自己的指标metrics
虽然go-prometheus包含了一些metrics,但是毕竟自己的golang有时必不可少的满足不到已有的metrics,就需要加入自己的指标
网关转发数量
 TotalCounterVec = prometheus.NewCounterVec(
   prometheus.CounterOpts{
      Subsystem: "go",
      Name:      "forward_total",
      Help:      "Total number of host forward",
   },
   []string{"host"},
进行网关转发中的并发请求数量
 Concurrent request sGauge = prometheus.NewGauge(
   prometheus.GaugeOpts{
      Subsystem: "go",
      Name:      "request_handle_concurrent",
      Help:      "Number of incoming HTTP Requests handling concurrently now.",
   },
)
网关转发的延迟响应时间
 LatencyRequestsHistogram = prometheus.NewHistogramVec(
   prometheus.HistogramOpts{
      Subsystem: "go",
      Name:      "request_handle_latency",
      Help:      "Histogram statistics of http(s) requests latency second",
      Buckets:   []float64{0.01, 0.1, 0.2, 0.5, 1, 2, 5, 10, 30},
   },
   []string{"code"},
)
通过boot4go-prometheus集成fasthttp
fasthttp目前不支持prometheus的集成,所以在做boot4go-gateway的过程中,把这块的东西单独拿出来,作为一个golang的独立包项目,该项目地址在
注册采集器
 prometheus.MustRegister(Concurrent Request sGauge)
prometheus.MustRegister(LatencyRequestsHistogram)
prometheus.MustRegister(TotalCounterVec)
加入RequestHandler
 return prometheusfasthttp.RequestCounterHandler(func(ctx *fasthttp.RequestCtx) {

   host := string(ctx.Host())

   if string(ctx.Path()) == "/metrics" {
      prometheusfasthttp.PrometheusHandler(prometheusfasthttp.HandlerOpts{})(ctx)

      return
   } else {
      if next != nil {
         TotalCounterVec.WithLabelValues(host).Inc()
         startTime := time.Now()

         ConcurrentRequestsGauge.Inc()
         defer ConcurrentRequestsGauge.Dec()

         next(ctx)

         finishTime := time.Now()
         LatencyRequestsHistogram.WithLabelValues(
            strconv.Itoa(ctx.Response.StatusCode())).Observe(float64(finishTime.Sub(startTime) / time.Second))
      }
   }
})
程序方面就差不多了,下面就到重头戏,Grafana+Prometheus了
作为开发人员的我,其实对这些 运维 工具是特别有兴趣的, 这些工具的集成和搭配以及选型,才是多元化的,才正在的有味道。