上接文章
为什么要为boot4go-gateway搭建Grafana+Prometheus
有关注的朋友看到这个项目,非常关注gateway的并发压力测试的结果,boot4go-gateway的http服务没有使用go net/http的原生http服务,使用的fasthttp改造后的http服务,在单一请求访问的情况下,fasthttp的性能秒杀go net/http,当然虽然go net/http性能已经比springboot系列的 tomcat 优秀不少,但是和fasthttp还是相形见绌了, 研究过fasthttp的底层代码,其实对于go语言开发来说,fasthttp使用比较好的复用技术,进一步的提高了net/http的优化空间,将性能做到了警可能的压缩,今天先暂且把这个放一边。回归到咱们的boot4go-gateway的压力性能测试。
boot4go-gateway如何可以集成到Prometheus里
在boot4go-gateway里使用fasthttp作为http服务的底层, 在其中集成了prometheus的client,进行性能指标的采集, 把采集到的指标通过 export 的方式,让prometheus进行采集,然后grafana以prometheus作为数据源,prometheus也是个好东东,prometheus的TSDB,也是用的比较多的, 在物联网的项目中,对传感器以及iot终端的数据进行时间维度的分析,是非常好的东东,有兴趣的朋友可以看看相关的资料, TSDB以及influxDB, 我比较习惯用prometheus的TSDB, influxDB功能类似,现在influxdata已经打包了telegraph,也可以完成prometheus和grafana一样的功能,不过一个是push一个是pull,各有各的优势,看你节点结构和部署方式来进行选择吧,都非常的不错。
这里我在boot4go-gateway里进行性能测试的数据监控采集,使用的promethues+grafana的方案。在boot4go-gateway里在原有的boot4go-prometheus的基础上增加了3个采集器。
网关转发数量
 TotalCounterVec = prometheus.NewCounterVec(
   prometheus.CounterOpts{
      Subsystem: "go",
      Name:      "forward_total",
      Help:      "Total number of host forward",
   },
   []string{"host"},
进行网关转发中的并发请求数量
 Concurrent request sGauge = prometheus.NewGauge(
   prometheus.GaugeOpts{
      Subsystem: "go",
      Name:      "request_handle_concurrent",
      Help:      "Number of incoming HTTP Requests handling concurrently now.",
   },
)
网关转发的延迟响应时间
 LatencyRequestsHistogram = prometheus.NewHistogramVec(
   prometheus.HistogramOpts{
      Subsystem: "go",
      Name:      "request_handle_latency",
      Help:      "Histogram statistics of http(s) requests latency second",
      Buckets:   []float64{0.01, 0.1, 0.2, 0.5, 1, 2, 5, 10, 30},
   },
   []string{"code"},
)
通过boot4go-prometheus集成fasthttp
fasthttp目前不支持prometheus的集成,所以在做boot4go-gateway的过程中,把这块的东西单独拿出来,作为一个golang的独立包项目,该项目地址在
注册采集器
 prometheus.MustRegister(Concurrent Request sGauge)
prometheus.MustRegister(LatencyRequestsHistogram)
prometheus.MustRegister(TotalCounterVec)
加入RequestHandler
 return prometheusfasthttp.RequestCounterHandler(func(ctx *fasthttp.RequestCtx) {

   host := string(ctx.Host())

   if string(ctx.Path()) == "/metrics" {
      prometheusfasthttp.PrometheusHandler(prometheusfasthttp.HandlerOpts{})(ctx)

      return
   } else {
      if next != nil {
         TotalCounterVec.WithLabelValues(host).Inc()
         startTime := time.Now()

         ConcurrentRequestsGauge.Inc()
         defer ConcurrentRequestsGauge.Dec()

         next(ctx)

         finishTime := time.Now()
         LatencyRequestsHistogram.WithLabelValues(
            strconv.Itoa(ctx.Response.StatusCode())).Observe(float64(finishTime.Sub(startTime) / time.Second))
      }
   }
})
程序方面就差不多了,下面就到重头戏,Grafana+Prometheus了
作为开发人员的我,其实对这些 运维 工具是特别有兴趣的, 这些工具的集成和搭配以及选型,才是多元化的,才正在的有味道。
搭建Prometheus
当然的,直接上 docker ,本身就是为自己的压力测试做准备环境的,用最低的代价最快的速度即可。
prometheus的镜像是使用的自己的里prometheus的私有镜像,里面有些自己定制化的东东。
有兴趣的朋友, 可以在里搜索joinsunsoft; 里面有一些public出来的好东西,里面还有k8s的image, 这里大家可以直接拿官方镜像就行, 镜像名 prom/prometheus
启动后加入boot4go-gateway的exporter。 这个按照自己的喜好加就行, 例如 我的规范
   - job_name: boot4 go -gateway-group01
     static _configs:
      - targets: ['192.168.56.1:9000']
        labels:
          type: gateway-server
          group: default
如果嫌弃这个麻烦,可以通过push自动注册的方式进行prometheus里的endpoint注册。
访问 prometheus 看是否exporter生效

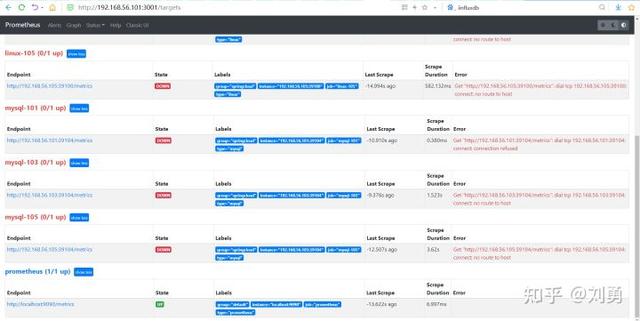
就仅仅这个prometheus的target list的页面里的数据,就深深的能够反映出fasthttp由于go net/http的性能。看上面的图, 图最上的是咱们用fasthttp开发的boot4go-gateway,其中Scrape Duration一栏就是http请求的请求时间,


比较一下底下的一个,是prometheus自己的exporter,prometheus是用golang写的,使用的是go原生的net/http包作为http服务, 在docker容器里自己pull自己的响应比处于不同机器的boot4go-gateway的响应时间要多了2倍多,
再看看数据包的大小
这个是prometheus exporter的包大小

这个是boot4go-gateway的metrics包的大小

fasthttp还是要快了不少
搭建Grafana
还是一样的哦,上docker,
grafana的镜像是使用的自己在里grafana的私有镜像,
官方镜像 grafana/grafana
启动grafana后,选择prometheus作为数据源, 然后定义boot4go-gateway的dashboard, 这里需要掌握有关prometheus的ql语法和使用, 以及grafana的相关指标panel的设置和参数提取, 为了方便大家开箱即用,我已经在grafana的官网里发布了boot4go-gateway的dashboard,大家直接import到自己的grafana里即可
boot4go-gateway
Dashboard ID: 16262
网址 Boot4GO-Gateway dashboard for Grafana | Grafana Labs
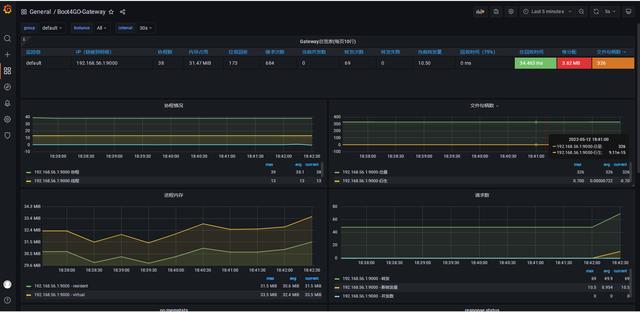
效果图
开始测试
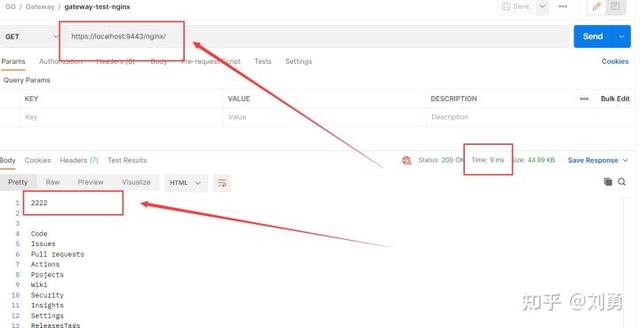
赶紧试试gateway发送几个请求, 现在是用postman来进行测试
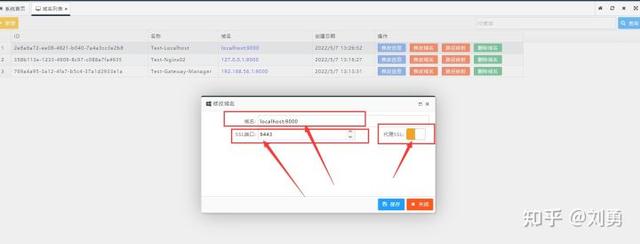
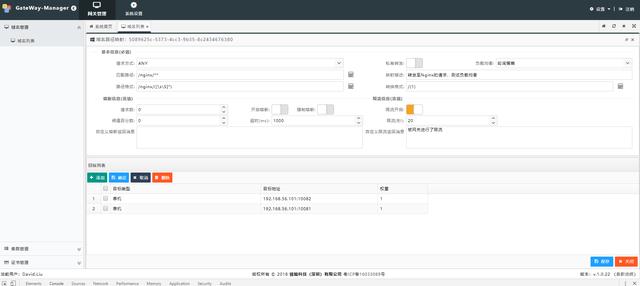
Gateway的反向代理配置,
gateway在本机上启动端口9000,启动 SSL 端口 9443,配置了2个 nginx 作为目标机器
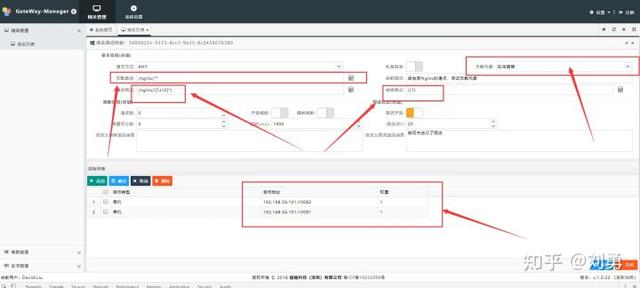
转发配置
配置了映射路径为/nginx/**
目标机器映射为两个docker上的nginx分别是192.168.56.101的10081和10082端口,使用的负载均衡策略是 轮询 请求,映射的路径转换规则 将 的请求转换为 或者 映射规则测试用了个简单的,还可以使用场景化更复杂的规则进行转发
Let go,测试吧
使用postman进行测试(包大小为 45KB)
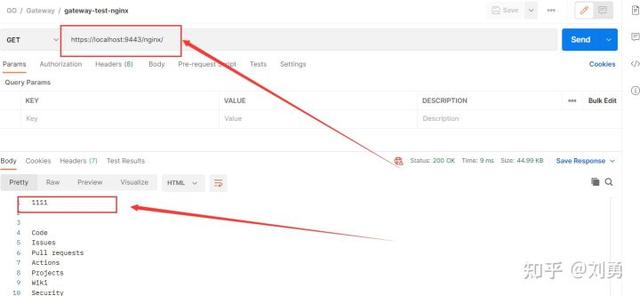
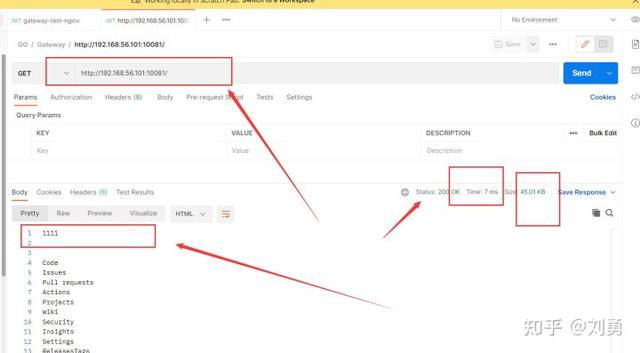
直接访问Nginx机器的效果
访问Nginx1
访问Nginx2

查看监控面板

这里可以看到,协程数,内存量,分配数,句柄数,都是稳定的,这也是fasthttp的池化的体现
尾声
监控系统的搭建,目的是为了在进行压力并发测试的时候,可以收集到机器的各种性能参考和分析指标,以便在性能测试的过程中比较好的了解机器的运行状况,进行性能测试的分析以及后期的优化。
下一集将进行压力并发测试
压力并发测试,将使用2种不同的方式进行,一种是使用golang来写客户端,进行测试。这种方法比较容易,但是模拟的场景比较简单。
另一种方式通过 jmeter ‘进行更多的压力和负载场景测试
我们将使用两个方法都进行测试。